Quote:
Originally Posted by roughbeast

Don't let those graphs mislead you, especially if they are SH3 graphs. I understand from other posts here that the shocking appearance is mostly due to software issues, not a reflection of true latency.
For example I just did a speed test with 11ms latency and 331Mb down speed. Here's my tbb graph for the same time.
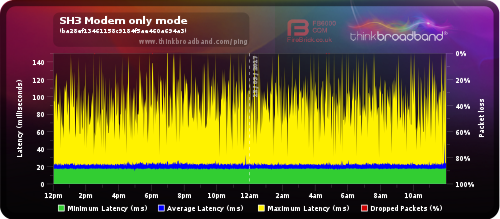
It looks much worse than my old SH2 graphs, but with similar latency. |
It's the other way round, a speedtest doesn't give you a true reflection of latency and a BQM will only identify ICMP traffic in particular, but the hub 3 spikes on TCP/UDP, which is a true reflection of 'internet usage' (for lack of a better word).