Quote:
Originally Posted by Mythica

Just wondered what people think of these graphs.
I'm on 200Mb with the hub 3. The other day it went down and it turned out that VM were working in the area, we were on 16 down and 2 up and after the work we are now on 24 down and 2 up. The graphs seem to have got worse since they did the work.
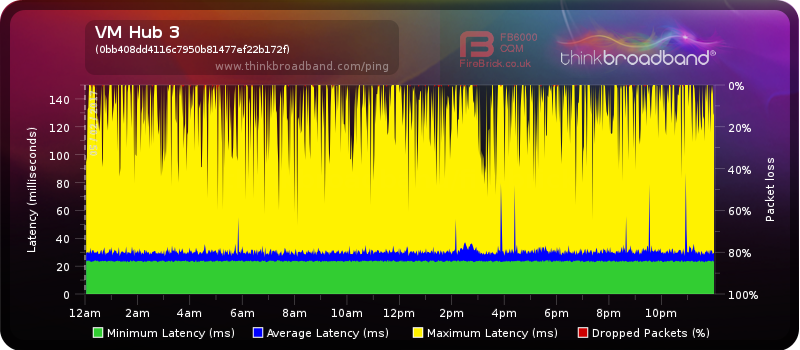
Today (5/2/17)
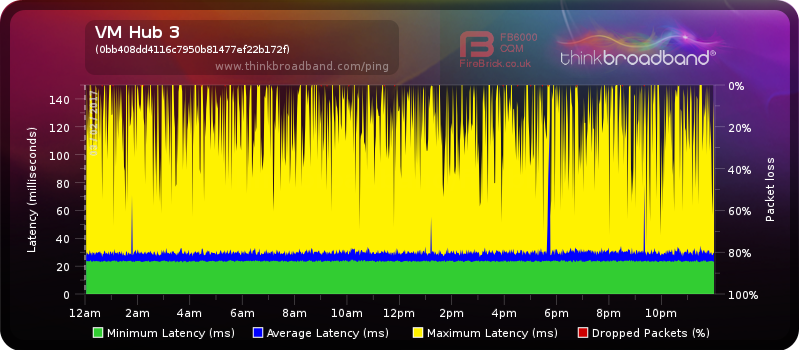
Friday (3/2/17)
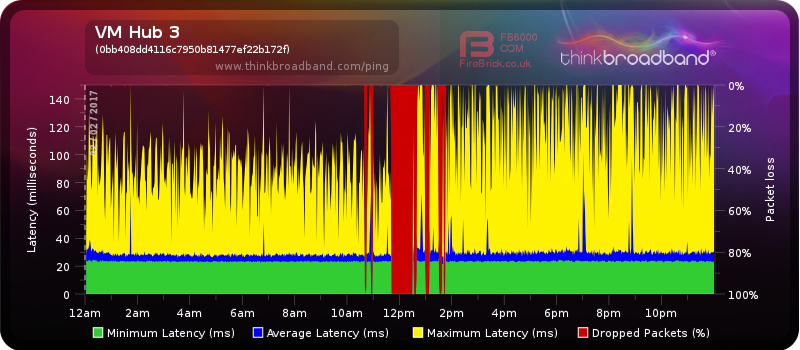
Day of the work (2/2/17)
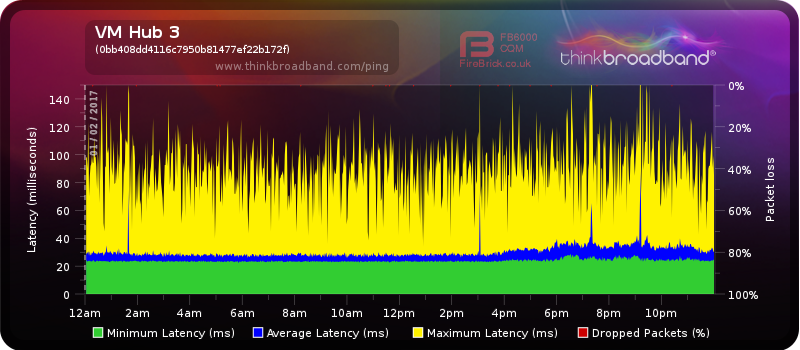
Day before work (1/2/17)
 |
Pretty normal graphs for most people with a Hub3 with the odd exception(Sephiroth).
The reason you have gained more yellow is from the increase in downstream channels, I am on 16 but i always feel it doesnt affect my browsing or gaming.